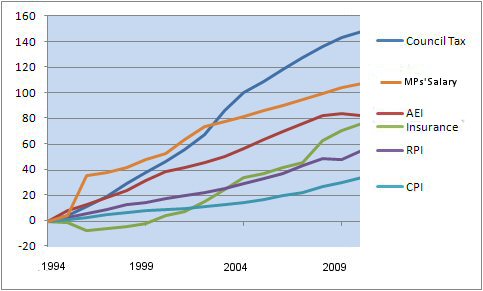
- The above chart illustrates how the Consumer Price Index (CPI), Retail Price Index (RPI), and Average Earnings Index (AEI) have grown over the the last 17 years from 1994 to 2010. Also shown is the much faster growth of the Council Tax and Household Insurance costs both of which are excluded from the CPI but which together can amount to as much as 15% or more of a pensioner's income.
- The Average Earnings Index is also included for comparison but note that from 2010 this has now been replaced by the Average Wages Index.
- The rise in MPs' Salaries is also added for comparison.
- If CPI indexation had been introduced in 1994 by 2010 a pension would have been 10.8 % lower than that for the RPI and 34.4% lower than that for the AEI.
Research by both by the Alliance Trust and, more recently, Age UK has questioned the suitability of current indices of inflation for use with retirement benefits, e g the Basic State Pension and occupational pensions. The studies show that:
- Inflation rises with age - on average in the last two years the inflation rate of the oldest households run by the over-75s was 67% higher than that of the youngest households (under 30s).
- In every month of the two years studied (2003 and 2004) homes run by people of retirement age (65+) faced higher inflation than those of working age.
- The biggest difference between the oldest and youngest groups was in April 2004 when the inflation rate for homes run by over-75s was more than 136% higher than that for homes run by under-30s. The smallest difference between the two groups' inflation was 28% in March 2003.
- The oldest households' average inflation was 36% higher than the average experienced by all households.
However the Alliance Trust studies really understate rises in the cost of living for pensioners. The authors based their research on data from the Expenditure and Food Survey (EFS) and the Consumer Price Index (CPI) which both differ in many respects from the Retail Price Index (RPI). Although the "shopping basket of goods and services" for the CPI is very similar to that of the RPI, the CPI specifically excludes Council Tax expenditure, for example. The CPI is also designed to be lower than the RPI as its calculation is based on geometric means as opposed to arithmetic means. See: The difference between an arithmetic mean and a geometric mean. And why it matters.
Council Tax is of course a major item of expenditure for a great many pensioners. The average annual disposable income of households with 2 retired persons is about £14k which should be compared with that for all non-retired households (on which most of the RPI is based) of £29k. On average, Council Tax is about 6% of a retired household's disposable income compared with only 3% for the non-retired.
Clearly there is a case to be made for a more suitable index for inflation proofing of all pensions. In fact for some years now the Office for National Statistics (ONS) has published two versions of an RPI just for those pensioners who are largely dependent on benefits, one for one person and the other for two person households. Some items in the "shopping basket" for these, which are in the standard RPI, are excluded, e g, canteen meals (including state school meals) and all housing sections . The exclusion of workplace and school meals is obvious; the exclusion of the housing sections was made on the grounds that the price indicators used in the all items RPI "would not be appropriate and would overstate the price increases experienced by these pensioners as they would mostly be cushioned against some rises by rebates". The ONS says "it would be technically difficult to compile separate house price indicator items for these households". Whereas it might be justifiable to exclude mortgage interest payments because 69% of the retired households are owned outright it is difficult to see the case for excluding Council Tax and household insurance. Housing benefits concentrated at the lower levels of income only amount on average to about 4% of the disposable income.
|